Agentic shopping, built on real-time household consumption data.
Trepo is the operating system for the kitchen. Households use it to know what they have and cook with it — and every time they do, it records what a real home actually eats.
Households get their kitchen back. The market gets a signal it has never had.
Trepo · Confidential
The Problem · 1 of 3
Food has never been more available.Managing it is still manual.
Delivery in an hour. Ten thousand items in an aisle. There is still no system for the part that comes after it arrives.
🧠
You shop from memory, so you buy it twice
Nobody can see their own pantry from the store. The third jar of cumin is a visibility problem, not a discipline problem.
🗑️
Then you throw it away
What you forgot you owned goes off behind what you bought instead.
2 · The Problem
The Problem · 2 of 3
Every tool stops at the checkout line.
A whole industry exists to get food into the home. Almost nothing exists for the six days it sits there.
→Delivery apps optimise the order, then go dark at the door.
→Recipe apps assume you will go and buy the ingredients. They do not know you already own most of them.
→Lists and notes never deplete. Nothing comes off on its own.
→The fridge is a black box the second the door closes.
The gap
We measure buying down to the cent. We do not measure eating at all.
So the one fact that decides the next shop — what is in the house, and how fast it is going — is the one fact nobody writes down.
3 · The Problem
The Problem · 3 of 3
So the brands selling you foodare flying blind too.
Retail media is the fastest-growing ad channel in the world, and it runs on purchase history. One retailer sees one basket. Everything else is a model of what probably happened.
Four questions no brand can answer today. We can answer all four, per household, per week.
What else came home with it?
The whole basket around your brand — including the banners you have no data from.
Did they buy it again?
Trial or repeat, observed in the home instead of inferred from a loyalty card.
How long was the gap?
Days between one purchase and the next. The replenishment window, per household.
Planned, or impulse?
On the list first, or only at check-in. One is a habit. The other is winnable.
Both problems are the same missing dataset. The household cannot see its own kitchen, and neither can anyone selling into it.
4 · The Problem
The Insight
Consumption is the only honest demand signal.
Purchase data is a lagging guess. Everyone measures the checkout. Nobody measures the pantry.
Why it is true
A purchase says a unit left a shelf. Consumption says it was used, and is about to be needed again.
Why nobody has it
It cannot be bought. It exists only if a household chooses to tell you, week after week.
Why it lets us win
An agent that shops for you needs to know what you have, not what you once bought.
5 · The Insight
The Insight, Applied
One kitchen. Nothing asked.All of it observed.
Nobody fills in a profile. The household just uses the product, and the pattern falls out of the timestamps.
Logs at 6:40pm, weekdays only
Nothing at midday Monday to Friday, plenty at noon on Saturday. They work outside the home.
Twelve-pack in Saturday, gone by Wednesday
Three cans a day, every week, for months. We know the Thursday before they run out.
Yogurt every nine days, then nothing
They did not run out and they did not stop eating yogurt. They switched brands — and we can see to what.
Three different stores in one week
Club, discounter, corner shop. The whole basket — which no single retailer can assemble.
Today a brand pays to reach “households that probably buy soda.” We can tell them which home runs out on Thursday.
6 · The Insight
The Solution
Make logging worth doing, andthe signal builds itself.
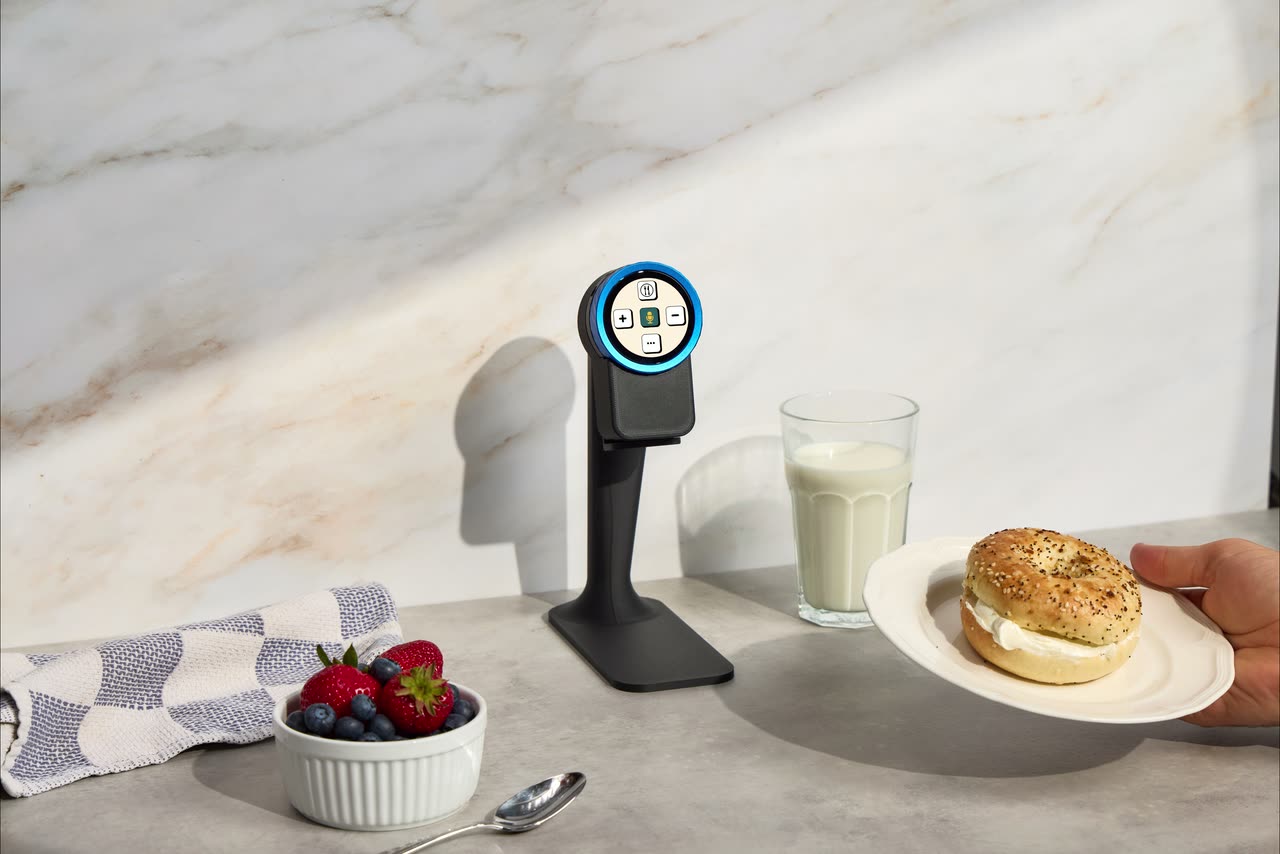
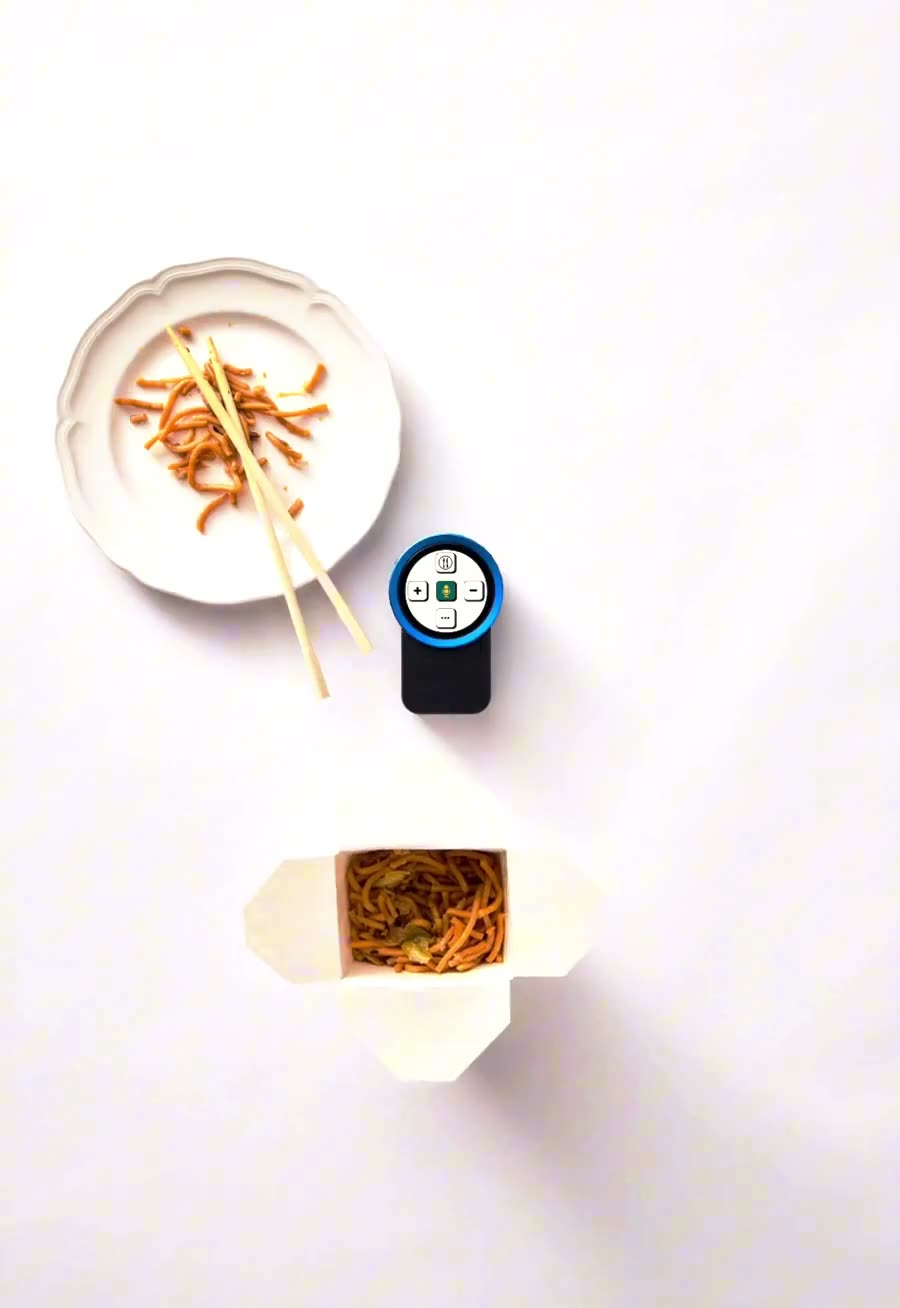
Trepo tracks what a household has, tells them what they can cook with it, and turns what is running out into the shopping list. Halo sits where the food is, so logging costs a second and happens at the moment it is true.
Log the meal
A logged meal is also a nutrition record. The same data that runs the pantry describes the diet.
Log the leftovers
What went back in the fridge, and when. The thing every other system loses track of entirely.
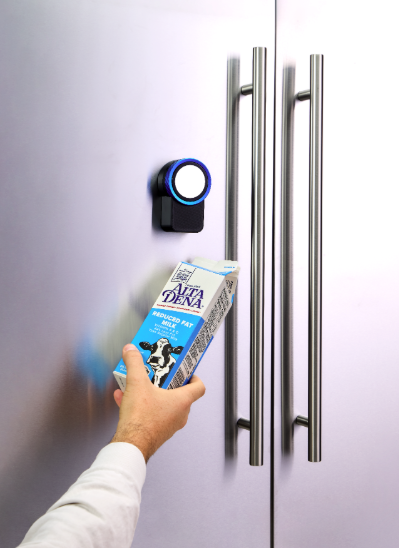
Scan it on the way out
Take the last of the milk, scan it, and it moves itself onto the shopping list.
The wedge
The app. It drove every number on the traction slide.
The depth
Halo. It turns occasional logging into continuous measurement, and it is the hardest part to copy.
The asset
The graph. It compounds with use and cannot be bought at any price.
7 · The Solution
Product
Four reasons to open it.Every one of them writes data.
Nobody is asked to track anything. Each job the household actually wants done narrows the signal one step further — from everything that came in, to what they are about to buy.
Check in
Photograph the receipt, the fridge or the pantry shelf — or just say it. Seconds of input, and the kitchen is current.
What came in
▼
See the kitchen
Do we still have that? Answered from the aisle instead of from memory, with what is near the end of its life on top.
What's standing
▼
Cook what you have
Save a recipe from social, the web or a photo of a page. Trepo says what you already own and what is missing.
Intent
▼
The list
What is out and what is about to be, by store. The surface a replenishment order eventually comes from.
Demand
8 · Product
Why Now
Agentic shopping is arrivingwithout its input layer.
Food access peaked. Management did not.
Availability has never been higher, and there is still no system for what happens once it is home.
Every platform is building an agent that buys for you.
The interface is close to solved. The data it needs is not.
Purchase data is too fragmented to run it.
A retailer knows what you bought at that retailer. It cannot see the other four stores. An agent built on one banner reorders a fraction of a household.
Logging finally got cheap.
On-device AI turned capturing consumption into a two-second act. That is why this dataset can exist now and could not five years ago.
A retailer sees its own share of a household. We see the whole house, because the household tells us directly.
9 · Why Now
Traction
We launched at the end of June.On 11 July it took off.
Six weeks from launch to twelve thousand households, with no paid acquisition engine behind it.
And they use it. Signups are cheap. Logged food is not — every number below is a household choosing to do work for us.
273,945
Items logged into kitchens
108,635
Recipes generated
45,921
Recipes saved
25,063
Saved straight off social
Signups and product metrics pulled live from production, 17–18 Aug 2026. "Recipes generated" is a live snapshot rather than a lifetime counter. Founder and team accounts are excluded. The July step-change is real and we are still instrumenting which channel drove it — we would rather say that here than have it found in diligence.
10 · Traction
Market Size
Two revenue lines.Both priced off what a public comp earns.
Built from the bottom up, off one household — and off what a public grocery platform actually earns.
Line one — replenishment transactions
US grocery store sales, 2025US Census Monthly Retail Trade$1.015T
US households, 2025US Census Bureau134.8M
Grocery spend per household$7,532
Transaction take, consumers and retailersInstacart transaction revenue is 7.1% of GTV, Q1 2026 — consumer fees plus retailer fees7.1%
Transaction revenue per household, per yearApplied to the whole $7,532 basket, not just the 19% transacted online today$535
At 5M households that is $2.7B a year. At 10M, $5.4B.
Line two — retail media
Instacart advertising and other revenue, Q1 2026Instacart Q1 2026 results — $286M in the quarter, up 16% year over year$286M
Applied to the whole household basket$7,532, not just the 19% online$211
Combined revenue per household, per year$746
A $100 cart returns about $9.90 to Instacart before expenses: 7.1% transaction revenue from consumers and retailers plus 2.8% advertising and other (Q1 2026). We price both lines off those rates. The difference is reach: they earn it against the orders they fulfil, we hold the whole household — every store, and what actually got eaten — which is the targeting and measurement layer they cannot build from their own checkout.
Needs your call — target households
5M is the recommendation: 3.7% of US homes, and roughly $3.7B a year across both lines at $746 a household. Matt and Zach to confirm before this is shown. Both comp rates — 7.1% transaction and 2.8% advertising — are what Instacart realises on the orders it fulfils. Applying them to a household's entire grocery spend, in-store included, is the thesis, not a proven rate.
11 · Market
Competition
Five patched-together tools.One system that replaces them.
Nobody set out to build this stack. A notes app for the list, a delivery app to order, a recipe app to decide, a loyalty card for the deal, and memory for everything in between. None of them talk to each other, and none of them know what is in the house.
Purchase data · lagging, fragmentedConsumption data · live, in-home
Retailer loyalty
Instacart
Panel & scan (NIQ, Circana)
Samsung Food, Whisk
Notes apps, paper lists
Trepo
One system, not five
The list, the recipes and the inventory are the same product. That is the consumer pitch, and it is why the logging happens at all.
Why they cannot cross
Their data is a by-product of a transaction they own. Nobody logs their pantry into a checkout.
What compounds
Every log makes the next recommendation better, which makes the next log more likely.
12 · Competition
Business Model
Sell the signal now. Take the basket later.
Phase 1 · Live
CPG data & retail media
Brands pay for what no panel can give them: household-level consumption on their category, across every banner their buyer shops. Already in market — our first partner one-pager went out on real portfolio data.
This round funds the ad products on top of it:
•Sampling — put product in the homes that just ran out of the competitor.
•Follow-along — did the sample get used, repeated, or abandoned.
•Closed-loop tracking — campaign exposure through to in-home consumption, not just a purchase event.
Phase 2 · Next
Replenishment transactions
Once the graph knows the cadence, the list becomes an order. We take a share of a basket the household was always going to buy.
$535 per household per year at a 7.1% take from consumers and retailers — a line that scales with households rather than with sales headcount.
We get there first. A retailer only learns you need it when you turn up and buy it — we know before that, so we are the one who asks.
Phase 3 · The swing
Both, compounding
Data revenue funds household growth. Household growth makes the data more valuable and the replenishment volume bigger. Neither line caps the other.
The end state is an agent that keeps a house stocked without being asked — and we own the only inputs it can trust.
Every household added improves both lines at once. That is the compounding we are asking investors to buy.
The device is not a revenue line. It is the highest-fidelity logging surface in the home, it deepens the dataset per household, and it pays for itself at point of sale.
13 · Business Model
The Team
We have been on both sidesof this trade.
Matt Taylor
Co-founder & CEO · Product and engineering
Builds the thing, hardware and software both. The Halo device, the firmware, the OTA pipeline, the ingestion backend and the Kitchen Graph itself are his. Previously Neuro and Tesla.
Placeholder
Matt's exact titles, dates and the two or three shipped accomplishments he wants named at Neuro and Tesla. Not inventing a bio for a diligence document.
Zach Slaughter
Co-founder · Revenue
Owns revenue, and has stood on both sides of the trade we are building. Retail media and advertising at Viant; CPG sales and marketing leadership at USCAPE — the buyer of this data, and the seller of the products it measures.
Placeholder
Zach's exact titles, dates and accomplishments. The framing above is the argument; the credentials need to be his words.
The pairing is the point. This company needs someone who can ship a consumer hardware and AI product, and someone who already knows what a CPG brand will pay for the data it produces.
14 · Team
Financials
Revenue, growth, projections.
Growth is the line that is real today: 2 households to 12,927, effectively all of it in six weeks. Revenue starts on the data side, where a partner conversation is already live. The replenishment line turns on once the graph is dense enough to predict cadence per category.
12,927
Signups
$746
Modelled revenue per household, per year — both lines
$XXk
Contracted data revenue
$XXk
Monthly burn
Placeholder · the model
A 24-month projection needs monthly burn and cash on hand. Give me both and the model gets built as a supporting document, which is where Icehouse says it belongs — alongside the cap table, the hiring plan and a written investor FAQ. The deck slide stays this thin on purpose.
Placeholder · revenue lines
Data revenue booked to date, pipeline value, and the assumed month the replenishment take-rate switches on.
15 · Financials
The Ask
The kitchen is the last unmeasured room in commerce.
We are raising $X.XM on a $XXM capSAFE to turn a working consumer product into the consumption layer that agentic shopping will have to run on.
Households
Take the graph from thousands of kitchens to the density where cadence becomes predictable per category.
The ad products
Build sampling, follow-along and closed-loop tracking on top of the data we already have, and convert live CPG interest into contracted revenue.
The replenishment bridge
Ship the leg that turns a list into an order — the product step that unlocks the take-rate business.
Confidential. Household examples are illustrative of the signal and anonymised throughout; behavioural data only, never personal identity. Amount, cap and instrument are placeholders pending founder sign-off.